20 November 2020
Asset Managers' holdings of sovereign debt during the COVID-19 pandemic
Carlos Cañon, Visiting Research Fellow, Qatar Centre for Global Banking & Finance
Global Asset Managers are important investors in the Emerging Economy sovereign debt market, and the COVID-19 pandemic could prompt a reduction in their exposure. Carlos Cañon has applied neural network forecasting models to redemption- and allocation-driven flows from Asia, EMEA and Latam to predict how different regions will be affected by changing appetites for their sovereign debt.

The COVID-19 pandemic created adverse conditions for the emerging economy sovereign debt market. In such a shock scenario, we would expect to see a typical ‘flight to quality’ response with a fall in demand for Emerging Economy (EME) debt and an appetite remaining diminished for some months. Non-banks play an essential role in this market, and policymakers should distinguish between them to respond effectively to their changing investment behaviours and identify their incentives.
The COVID-19 shock could affect the allocation and redemption-driven flows for EMEs in Asia, Latin America and EMEA and the implications associated with the different types of potential flow-recovery phase: V-shape, or U-shape, or Nike swoosh -shape. In line with recent literature about the impact of COVID-19, e.g. Arellano et al. 2020, a key issue that policymakers will have to consider, is the trade-off between supporting economic activity and sovereign default risk.
Who holds sovereign debt and what influences their decision making?
Global Asset Managers (AMs), one of the largest types of non-banks, respond to different incentives compared to other types of funds, with their behaviour being driven by their commitment to redeem investors at short notice. Collectively, AMs have significantly increased their holdings of sovereign debt, especially EME debt. At the end of 2018, their external assets and liabilities were equivalent to around 130% of EME GDP, a near-historic high for this measure of financial openness. Around 20% of EME bonds are now held by foreign investors, compared to 16.5% in 2006 (see Bush, Canon, and Gray 2020).
Fund managers modify their holdings of sovereign debt in a particular country based on two factors:
- Due to entrances and exits by investors in their fund, and
- As they change their asset allocation strategies based on their assessment of a particular country’s debt relative to alternative economies.
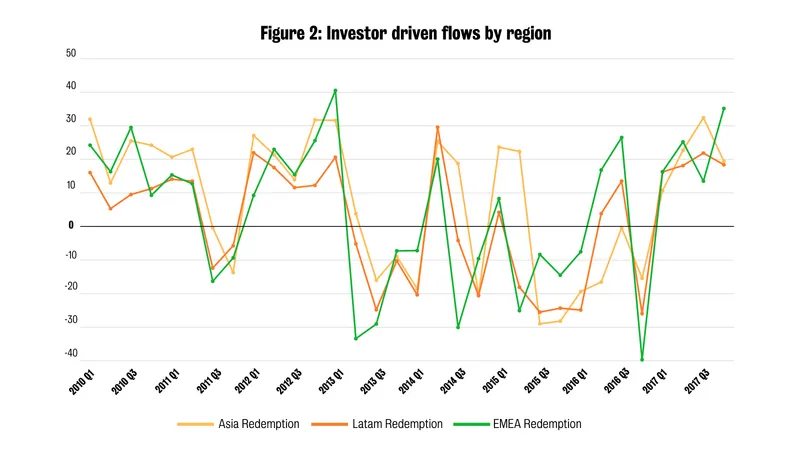
Flows driven by investor redemptions show a higher degree of correlation between regions than flows driven by the changes in AMs’ asset allocation strategies.
Figure 2 shows that flows across regions move together, apparently responding to the same shocks, whilst figure 1 shows that some regions suffer outflows while other regions experience inflows.

Differences in these allocation-driven flows could have material consequences on countries’ recovery from the COVID-19 pandemic by affecting their short-term access to financial markets, and consequently, the government’s spending capacity.
Data borrowed from Bush, Canon, and Gray 2020, shows that, between 2010 Q1 and 2017 Q4, while Asia and EMEA regions received important redemption-driven flows, Latin America received a larger volume of allocation-driven flows. This enables us to formulate predictions about how AMs will adjust their holdings of Emerging Market Economies’ sovereign debt.
COVID-19 Flow Recovery Scenarios
The pandemic triggered demand and supply-side shocks, each with different intensities and features, around the world. We conceive three flow-recovery scenarios to which Asset Managers could react along with the impact their reaction could have on EMEs in different regions.
Although there is a consensus about the short-term reduction in the holdings of EME sovereign debt by AMs, much is debated about their recovery dynamics. For example:
- Will AMs continue replacing EME sovereign debt with other assets?
- When will they start acquiring it again, and at what pace?
The conceived scenarios assume that EMEs sovereign debt market will be close to normality by the end of 2021. All scenarios track the dynamics across five quarters, of which the first two are the same across all scenarios and capture the outflows from EME sovereign debt. The last three quarters will be different for each case.
The V-shaped flow recovery scenario
The first case is the V-shaped scenario. It has two initial quarters where both redemption and allocation-flows are reduced by 10%, followed then by another two-quarters of a 10% recovery and a final quarter of 5% recovery. This case is usually cited as the best-case scenario for the pandemic and is often targeted by policymakers around the world.
The U-shaped flow recovery scenario
Second, is a U-shaped scenario. This scenario also has two quarters with flows reducing by 10%, then one quarter where flows do not change, and finally, two last quarters with a recovery of 10%. This scenario captures a situation where the recovery takes a while to start, but the recovery rate equals the severity of the impact.
The Nike-swoosh shaped flow recovery scenario
The third is a Nike-swoosh shaped scenario with two quarters of reducing flows, as in the previous two cases, but with a recovery of 8% during the third quarter, and 6% and 4% for the last two quarters. This last scenario captures the case where the flow recovery is much slower than the initial impact.
Questions and Predictive Models
We construct a multistage prediction model, with quarterly frequency and covering up to one year, for redemption- and allocation-driven flows for each region with a focus on the following questions:
- How might redemption and allocation-driven flows react for EMEs in different geographical regions (Asia, Latam and EMEA) given the COVID-19 shock?
- Since it's likely that regions will not share the same type of recovery, and bearing in mind the trade-off that exists between support to economic activity and future sovereign debt crises, what type of recovery should policymakers try to foster?
To answer the question of how redemption and allocation-driven flows might react for EMEs in different geographical regions (Asia, Latam and EMEA) given the COVID-19 shock, we compare the predictions with the 2010 - 2017 data and those with that same data augmented by an additional flow recovery phase (V-shape, U-shape, and Nike-swoosh shape) of five quarters.
To address the question of the kind of flow recovery that policymakers should try to implement, we assume that Latam is the region that will suffer the most with COVID-19 in terms of economic recovery. Asia and EMEA will both experience a V-shaped recovery. Thus, again we compare the predictions with the 2010-2017 historical data and the predictions with the historical data augmented by a V-shape recovery for Asia and EMEA, and either a U-shape or Nike-share recovery for Latam.
The Results
We only present the results with the Convolutional Neural Network (CNN) as those with Long Short-Term Memory (LSTM) are qualitatively similar and consistently exhibit a better fit according to the root mean square error criteria. Figure 3 presents the one-year predictions for the allocation- and redemption-driven flows at the regional level. In all figures, dashed lines represent predictions based on historical data augmented by a V-shape recovery, and bold lines predictions based on the historical data only. Figure 4 shows the RMSE for each quarter.
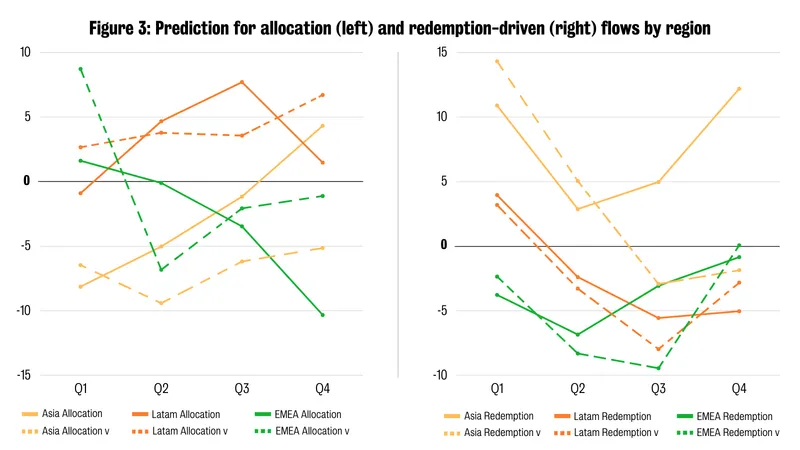
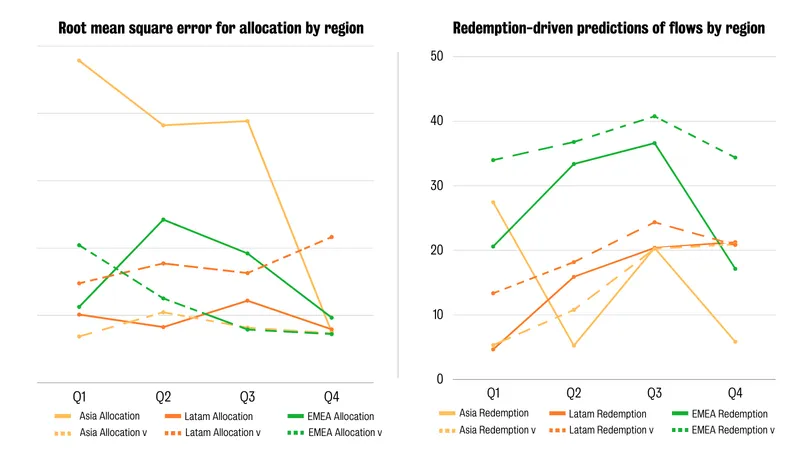
Looking at allocation-driven flows, our predictions based on historical data suggest Latin America is the only region constantly experiencing inflows. While Asia starts with outflows and finishes with inflows, EMEA has the opposite dynamic. After a V-type recovery, Latin America may continue to experience high levels of inflows, but EMEA, and especially Asia, would suffer outflows. Finally, Figure 4 shows that, except for Latin America, the fit of the predicting model improves with the V-type recovery.
For redemption-driven flows, we observe that Asia is the only region receiving inflows. After a V-type recovery, all regions would end-up with outflows, including Asia to a lesser degree. It should be stated that Figure 4 shows the fit worsens for every region after the shock and also confirms that redemption- and allocation-driven flows have different patterns.
To sum up our findings on how redemption and allocation-driven flows might react for EMEs in different geographical regions: assuming that all regions experience the same type of flow recovery, we find that a V-type recovery brings more redemption-driven inflows to Asia, at the expense of Latin America and EMEA, and brings more allocation-driven inflows to Latin America at the expense of EMEA and Asia.
Questions for policymakers
Regions will likely exhibit heterogeneous flow recovery patterns, raising many questions for policymakers. From the point of view of the lagging region, we are interested in what type of recovery they should try to foster. We highlight the benefit of adopting policies that differentiate countries from other EMEs (in line with Arellanno et al. 2020, Çakmaklı et al. 2020 and Espino et al. 2020), but also minimizing the effect on the sovereign default risk.
Figure 5 presents the situation in which Asia and EMEA experience a V-shape flow recovery, but Latam experiences a Nike or U-shape recovery. This case compares two flow recovery scenarios with a similar impact during the first two quarters, but one scenario with a slow flow recovery from the third quarter (Nike), and another scenario with no flow recovery for a quarter, followed by a sharp flow recovery for the last two quarters (U).
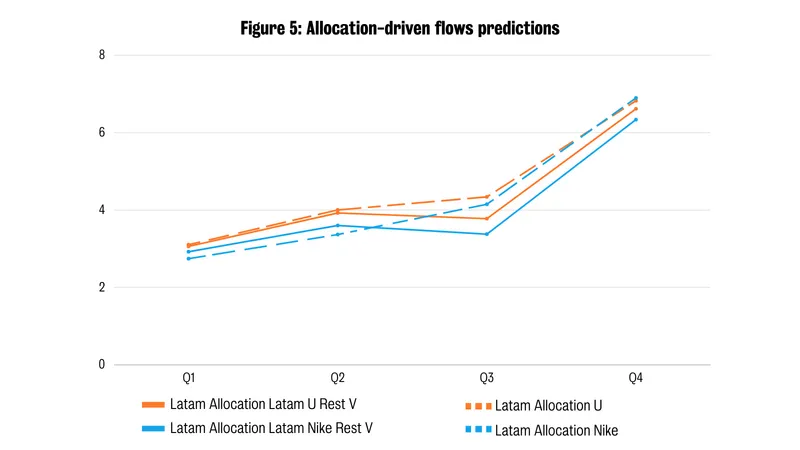
Figure 5 shows in bold lines, the prediction of allocation-driven flows for Latam when its flow recovery is either U-type (orange) or Nike-type (blue) and the other two regions experience a V-type recovery. Also, dotted lines are the prediction for Latam when all regions experience a U-type (orange) recovery or Nike-type (blue) recovery. Given that the shock has differentiated effects across regions, predictions for redemption-driven flows do not change very much across recovery scenarios and there is no clear effect for the lagging region, so to simplify the presentation we have not shown the chart for redemption drive flows.
We want to focus on two features. First, the inflows for Latam with a U-type flow recovery (orange) are higher than with a Nike-type flow recovery (blue) for every quarter in our predictions, particularly during the first three. Second, inflows for Latin America are higher, particularly after the second quarter, for scenarios where all regions share the same recovery pattern (dotted lines) than for those where Latam is lagging.
Both features send a message to policymakers, in particular those from the Latam region. Lagging behind other regions is naturally suboptimal from the standpoint of allocation-driven flows. Still, there are plenty of causes of a potential lag - such as having a large informal labour market or a narrow margin to issue new sovereign debt - that should be treated as exogenous at least during a one-year horizon. Our predictions suggest that having a U-type recovery, where the pace of the recovery is high, rather than a Nike-type recovery, where the recovery pace is slower, would produce higher allocation-driven flows.
Policymakers in each jurisdiction should try to make their country as attractive as possible compared to other EMEs with similar population levels and per-capital GDP. Recent literature stresses that lockdowns and economic stimulus, while improving health conditions, also significantly raise sovereign default risk. In making their decisions, policymakers need to be mindful of the potential impact of their fiscal and monetary policies on both the dynamic of the pandemic and on sovereign default risk. The more attractive the country becomes, the stronger the allocation-driven flows will be.
References
[ABM] C Arellano, Y Bai, and G Mihalache. “Deadly debt crises: COVID-19 in Emerging Markets.” Federal Reserve Bank of Minneapolis, Staff Report 603.
[BCG20] G Bush, C Canon, and D Gray. “Emerging market capital flows: the role of fund manager portfolio reallocation”. In: WP (2020).
[Bro20] Jason Brownlee. Deep Learning for Time Series Forecasting. 2020.
[CSSM20] Çakmaklı, C., S. Demiralp, Kalemli-Özcan, S. Yesiltas, and M. A. Yildirim (2020). Covid-19 and emerging markets: An epidemiological multi-sector model for a small open economy with an application to turkey. Technical report, National Bureau of Economic Research
[FSB20] FSB. Global Monitoring Report on Non-Bank Financial Intermediation 2019. Financial
In this story

Visiting Research Fellow, King's Business School