31 July 2024
Green gains and growing pains: a new measure of firms' exposure to climate transition
Joseph Noss, Visiting Fellow at the Qatar Centre for Global Banking and Finance, Carlos Lastra and Zining Yuan
This blog finds that there is little, if any, correlation between firms’ exposure to climate transition and their emissions.

We introduce a new dataset to investigate firms’ exposure to climate transition – that is, the degree to which their value will change in a scenario where global temperature increases remain well-below two degrees centigrade. Firms’ exposure to climate transition varies by sector and geography. This reflects both differences in industrial processes, as well as the strength of industry and policymaker commitments to net-zero transition in different countries.
We find there is little, if any, correlation between firms’ exposure to climate transition and their emissions. This may mean that investors that use firms’ emissions as a proxy for the degree to which their value will change under a possible future reduction in emissions, may be misestimating their exposure to the opportunities and risks associated with net-zero transition.
The effects of climate change on the global economy are becoming more proximate. There is growing recognition that the vast majority countries, economies and firms are likely to be affected by climate transition – that is, a possible transition to lower emissions. Climate transition may yield both winners and losers: that is, both firms that profit and those that lose due to global efforts to reduce emissions.
This article introduces and explores a new data set. This consists of estimates of firms’ exposures to climate transition – that is, the degree to which their value will change under a well-below two degrees scenario.
We find that firms’ exposure to climate transition vary by sector, with firms in the energy sector – particularly those involved in the generation of non-renewable energy – estimated to decrease in value under transition. In contrast, firms engaged in renewable energy generation look set to increase in value. Fewer firms are estimated to fall in value due to climate transition in Europe compared to the North America and Asia; this may reflect differences in the perceived strength of policymakers’ commitment to climate transition across these geographies.
In aggregate there is little, if any, correlation between firms’ exposure to climate transition and their emissions. In particular, some firms are high emitting, yet stand to gain from transition to lower emissions, and vice versa. Investors and policymakers that use firms’ emissions as a proxy for how their value might change under climate transition may therefore be misestimating their exposure to financial opportunities and risks associated with climate transition.
Data on firms’ exposures to climate transition
Our data consist of estimates of the degree to which firms’ enterprise value will change under a well-below two degrees scenario for global warming, versus that implied by the market value of their equity and debt today. As such, it can be thought of as an estimate of the degree to which the value of firms would change were market participants – in particular, firms’ investors – to align around a scenario of well-below two degrees of global warming. Data are available for around 3000 firms internationally, including for the constituents of major international equity indices.[1]
Crucially, the estimates embodied in the data are not based on firms’ emissions. Instead, they consider how broader changes in consumer preferences, technology and regulation are likely to impact demand for – as well as the cost and price of – firms’ products and services under climate transition. They therefore capture the degree to which some firms might benefit from transition to lower emissions, including those that are higher emitting. In doing so, they account for the degree to which some industries – e.g., those that drive innovation in hard-to-abate sectors – may increase in profitability, even if they have high emissions.
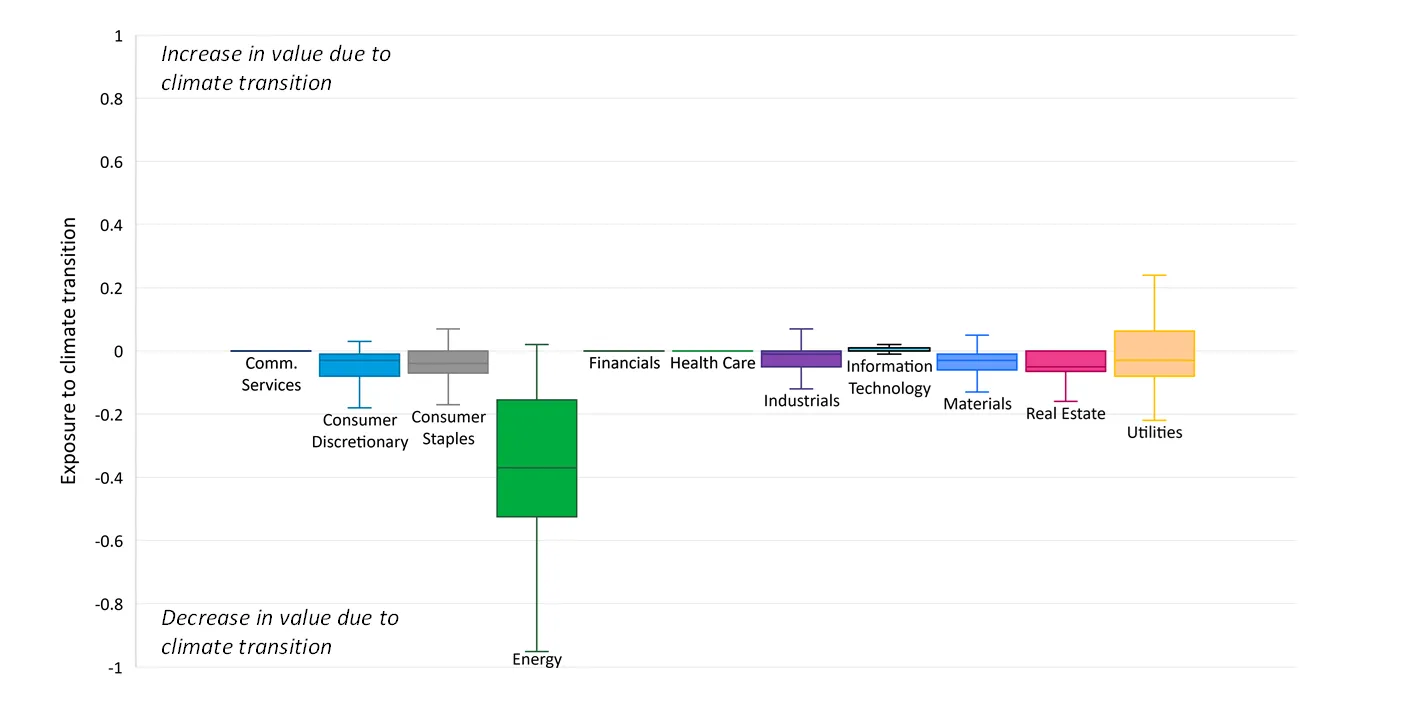
The average exposure of firms to climate transition – and the degree of dispersion around this – varies considerably across sectors (Chart 1). The average exposure of firms in most sectors is negative, if generally close to zero; in other words, the average firm in most sectors is expected to decrease slightly in value as a result of transition. This reflects the aggregate capital investment required to maintain firms’ profitability under net-zero transition. The average of exposure of firms in the energy sector is around -30%. One exception is the utilities sector, which includes firms engaged in renewable energy production, and where the average exposure is positive (i.e., these firms stand to gain from transition). There is considerable dispersion in the industrials sector, which reflects differences in firms’ industrial processes and ambition of their net zero targets.
Chart 1: The average level and dispersion of firms’ exposure to climate transition, by sector

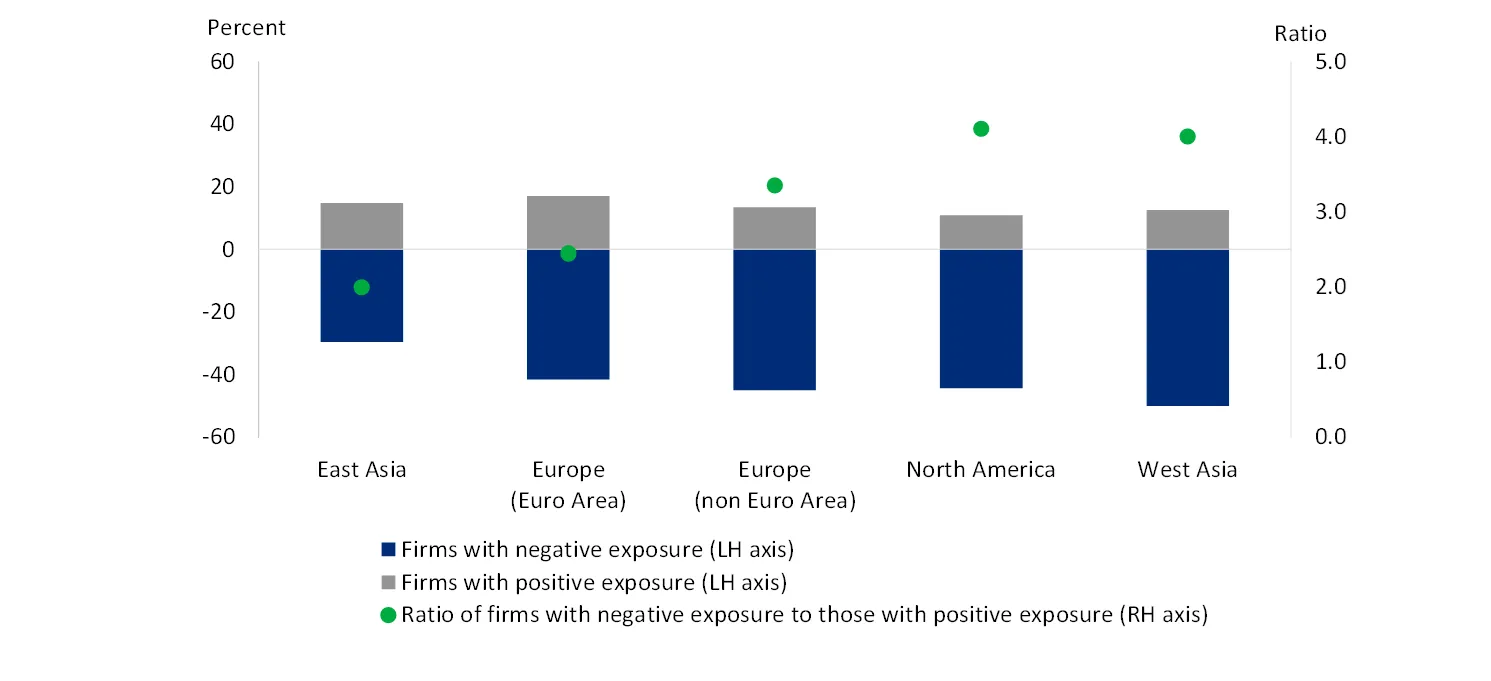
There is also some variation in firms’ exposure to transition across countries. Chart 2 shows the percentage of firms across a range of geographies that have positive and negative transition exposure. Dots on the chart show the ratio of firms with negative exposure to those with positive exposure, which higher in North America and West Asia than in other geographies. This might reflect the relative strength of policymakers’ commitments to climate transition across these geographies. All-else-equal, a stronger (actual or perceived) commitment to climate transition in Europe might prompt a greater shift by firms to business models that are more likely to profit as a result of climate transition.
A comparison of firms’ climate transition exposure and their emissions
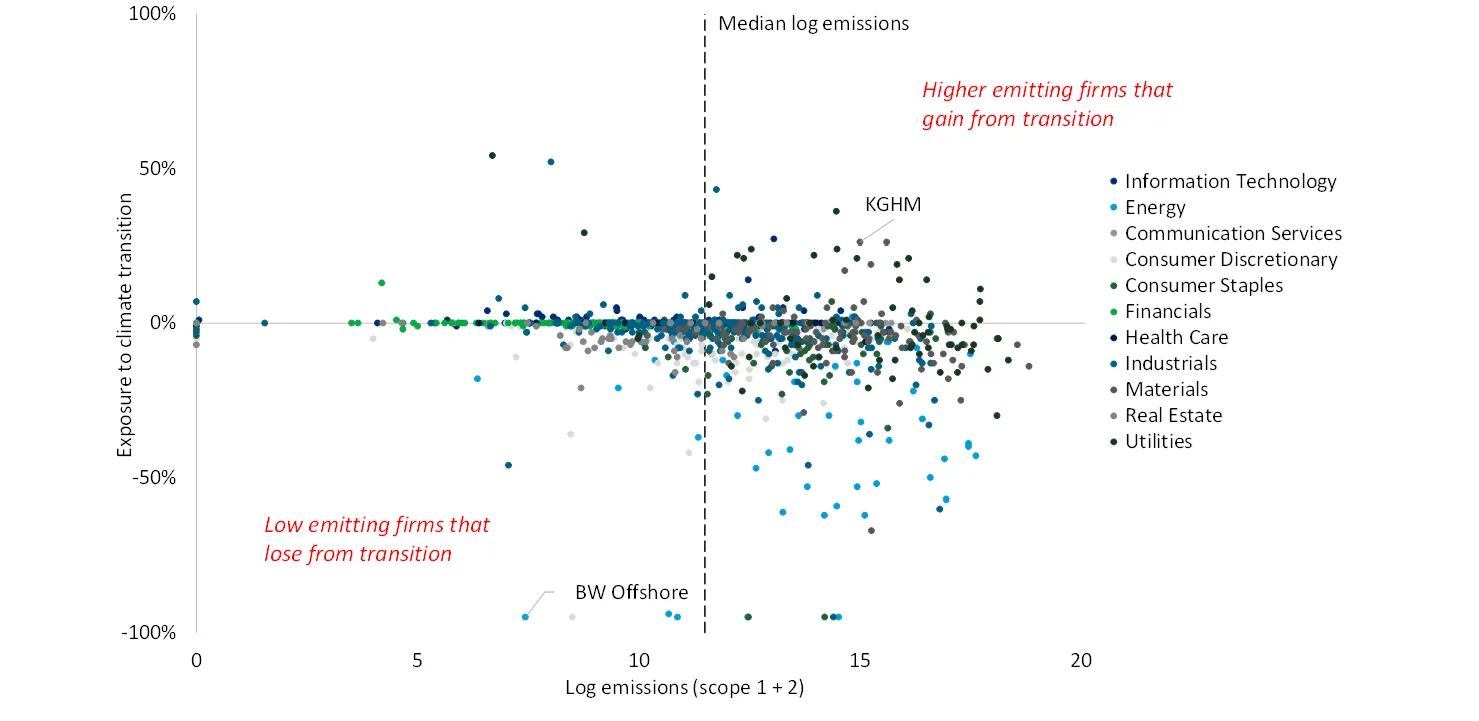
Perhaps counterintuitively, there is little overall correlation between firms' exposure to climate transition and their emissions (Chart 3). Some firms are high emitting but have positive climate transition exposure. These include firms that are engaged in the extraction and manufacture of products and technologies that are likely to play a critical role in the transition to a lower carbon economy, even if their operations are themselves high emitting. One example, is the firm KGHM, which extracts and processes copper. Whilst this activity is relatively emissions intensive, the value of the firm may increase under transition as demand for copper – which is likely to play a key role in expanding and reconfiguring electricity grids – increases.
Conversely, some firms are lower emitting but have negative transition exposure. Such firms include, for example, BW Offshore, which supplies services to oil and gas companies. While such firms are not, in themselves, high emitting, they nonetheless stand to lose a result of net-zero transition
|
Chart 2: Proportion of firms with positive / negative exposure to climate transition, and ratio of firms with negative exposure to those with positive exposure, by geography |

|
Chart 3: Firms’ exposure to climate transition versus their (scope 1 & 2) emissions |

This lack of correlation between firms’ transition exposure and emissions has implications for both investors and policymakers. Investors that take firms’ emissions as a proxy for their exposure to climate transition risk (or lack of emissions as a proxy for climate transition opportunity) might be substantially misestimating their exposure to such risks and opportunities. Similarly, policymakers that attempt to channel capital into firms that are currently lower emitting – or even those that have transition plans to lower their emissions in the near future – might be acting counterproductively. Some firms that are higher emitting and stand to gain from transition might also be enabling transition in the wider global economy. For example, firms engaged in the extraction and refinement of minerals used in lower emitting technology may be playing an important role in allowing other households and businesses to lower their emissions.
Reducing the flow of funding to such firms might therefore present net-zero transition in the wider economy.
Conclusion
In this article we have introduced a new and novel source of data on firms’ exposure to climate transition. Our – albeit preliminary analysis – reveals some differences in firms’ exposure to transition across sectors and geographies. There is little overall correlation between firms’ transition exposure and their emissions.
We plan to use this analysis and results to examine how firms’ exposure to climate transition influences their corporate behaviour, including how they select the nature of their business, conduct their operations, incentivise their employees and attempt influence government policy.
The results of this analysis will be published in a series of forthcoming articles.
Footnotes:
[1] These data, which are produced by WTW, are termed ‘climate transition value-at-risk’. They consist of estimates of the percentage change in firms’ enterprise value that would occur were their investors to align in a belief that the world will experience a global increase in temperatures of below two degrees. Though the data are termed ‘value-at-risk’, they are point estimates of firms’ future appreciation / depreciation; as such, they have little in common with more established value-at-risk models. For further information on the data and their estimation see Noss (2022), ‘Seeing through the smog: towards a better measure of climate transition risk’.
[2] Scope 1 and 2 emissions are those emissions emanating to firms’ activities and their electricity supply / generation. Scope 3 emissions – which are those emanating from firms’ broader supply chains – are not included here as comparable data on scope 3 emissions is not available for many firms.
