09 March 2020
"Levelling up" public spending – the magic formula?
Colin Talbot and Carole Talbot
COLIN TALBOT AND CAROLE TALBOT: Are the regional differences in public spending justifiable and what alternative funding formulae might work?

Much of the discussion about “levelling up” the so-called “left-behind” towns, cities and regions of the UK focuses, quite rightly, on broad social, educational, economic and business issues.
“Levelling Up Government” is a project led by Professor Colin Talbot and Dr Carole Talbot, which focuses on what internal government processes can do to further this agenda, such as through public spending, public services, the civil service and structures of governance, including devolution.
This article is part of a series sharing analyses and promoting debate on these issues.
Public spending per person in the UK is not equal – at least not when measured by region or nation.
For example, if you lived in the South East of England, in 2017/18 the government spent over £2,000 or over 20 per cent less on you than if you lived in London. Or, if you lived in Scotland, Wales or Northern Ireland you got more per head than if you lived in England. An issue I touched upon in my previous piece on “levelling up” left behind areas.
There are bound to be some regional differences in public spending, but the question is are the differences in the UK justifiable? If we start from the principle that everyone should benefit equally from public spending, depending on their circumstances, are the current differences fair – and why are they changing?
The causes of the differences lie in a very obscure and under-investigated area of public policy – the world of so-called “formula funding”.
Unequal Britain
But first, just how unequal is public spending in geographical terms?
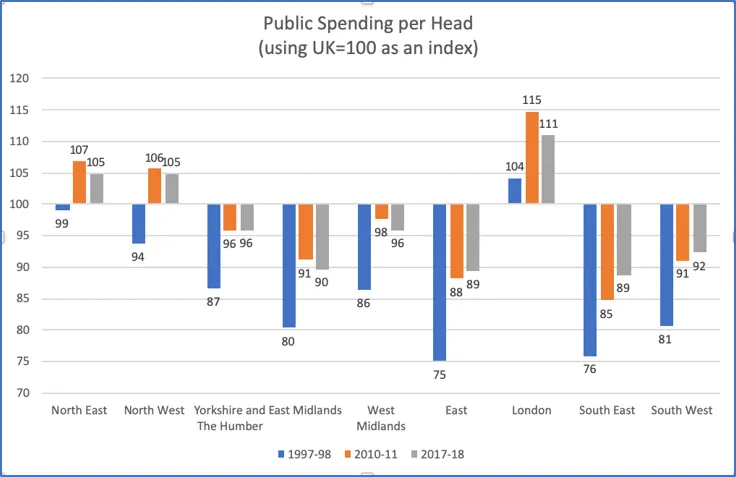
If we just look at the English regions, the answer is quite a lot. In the graph, we have used 100 as the average UK spend per person and compared that to the spend in each region.
We also did the figures for the New Labour period (1997-8 to 2010-11) and for the Conservative government-led period (2010-11 to 2017-18).
At the start of the New Labour Government only London was above UK average (100) spend – by four points or four per cent. Every other English region was below the UK average – in the Eastern region 25 percentage points below, the South East 24 points.
Under New Labour two important things happened. Firstly, both the North West and North East (but not Yorkshire and Humber) rose above the national average. Secondly, the overall gap between regions did narrow slightly–the “standard deviation” in regional spending per head fell from 10.2 percentage points to 9.9. It then dropped to 8.1 per cent under the Conservative-led governments.
But these are still quite large differences – a person living in the East Midlands had £383 less than the UK average in public money spent on them, and £1,990 less than someone living in greater London.
Magic formulae?
Since around the mid-late 19th century most developed countries have attempted to level-out both getting – through taxation, and spending across their national territories. Before that, certainly in the UK, public spending was largely decided at local level through things like the Poor Laws.
Most attempts at levelling spending have involved some sort of formula to decide how funds should be distributed, or cross-subsidised. An early example in the UK appeared in the 1929 Local Government Act. This included a formula for determining how much each English local authority should get.
Like nearly all such attempts at equalisation it started with the population of each territory. This was then modified by a number of other factors including the number of children under five, the numbers of unemployed men and women, the sparsity of the population, etc. And then finally a factor for the local income from rates was also added. The result was pretty complex.
Over the decades the number of such funding formulae have grown as they have been applied to more services and levels of government. And their complexity deepened as new factors have been added to reflect demographic, economic, and other factors.
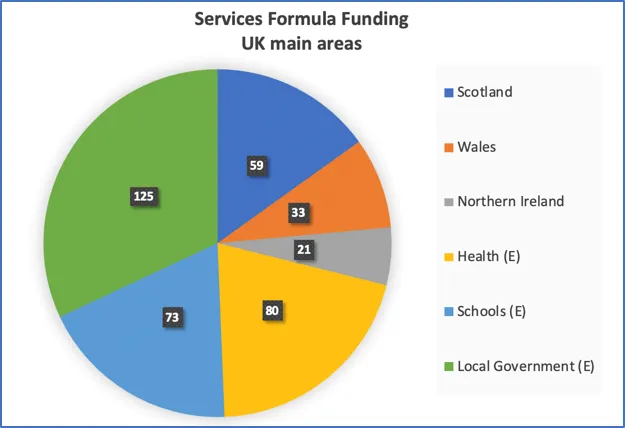
The amount of money the three devolved administrations – Scotland, Wales and Northern Ireland get from HM Treasury is determined by a complex arrangement known as the “Barnett Formula”. This accounts for around £113 billion of the regionally identifiable £650 billion of public spending – about 17 per cent.
Spending in England on three big areas – health, education and local government – is also determined by formula funding. This accounts for another £289 billion (44 per cent) bringing the amount covered by formulae up to 61 per cent of the total.
Other areas including policing in England and Wales are also covered by formulae, and some of the devolved, local and other area services use their own algorithms to determine how funds are further sub-divided.
It is safe to assume from this that all these various formulae play a major role in determining the outcome in the distribution of public spending at regional levels.
The Dark Arts of formula funding?
Formula funding is complex, often opaque, and has frequently led to complaints of it being politically biased. Most recently a Conservative Government review of local authority formula funding, conducted in 2018/19, provoked fury from Labour local authorities on the grounds that it downgraded “deprivation” as a criteria for adult adult social car funding, meaning that Labour councils would lose £327 million whilst Conservative Councils would gain £298 million.
Complaints of this type have been a regular occurrence in recent decades as funding formulae change under incumbent governments. In the light of such criticisms of formula funding being skewed for political benefit, are there other ways of addressing the problem?
The National Audit Office (NAO) carried out a “landscape review of formula funding for local public services” in 2011. It concluded that the “funding formulae [we] reviewed share the broad aim to allocate money to local bodies in response to their relative needs” continuing in typical NAO understatement, “the extent to which they have done so varies.”
Problems the NAO identified included funding models which are designed to respond to multiple objectives, which can be in conflict, and as a result “interpretation” and “judgement” (which is clearly code for politics) becomes a factor.
They also pointed out that “nearly 20 per cent of all authorities funded by Formula Grant in 2011-12 receive allocations more than 10 per cent from their calculated needs.” In other words, formula funding does not deliver.
Alternatives
Formula funding exists in most democracies and is clearly here to stay. So how can we mitigate the possible effects of political interference and produce better results? Some approaches have been tried in the past– for example the NHS’ Resource Allocation Working Party (1979-89). Another, much more developed system is the Commonwealth Grants Commission in Australia.
We will be exploring some of these alternative ways of managing the “levelling” of public spending in future posts.