19 August 2019
Mapping variation in palliative and end of life care
A new interactive atlas presents key end of life outcomes to help improve care for people who are dying.
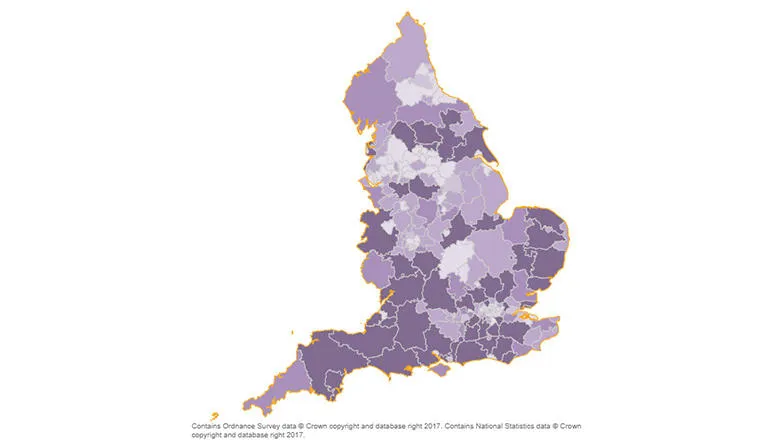
A core aim of the National Health Service is to provide a comprehensive service that is available to all. Understanding unwarranted variation in quality of care is important, particularly so for those who have limited time to live. The Atlas of Variation for palliative and end of life care is a tool produced by the National End of Life Care Intelligence Network that aims to shed light on variation in care towards the end of life across England.
The new Atlas offers an interactive tool that presents routinely collected activity and outcome data by geographical locality. The Atlas includes 17 indicators, including place of death, cause of death, hospital activity and number of patients in need of palliative care. With this tool you can view maps, charts, time series data and statistics across indicators.
Understanding variation in end of life care outcomes has been the focus of research at the Cicely Saunders Institute for many years. Over 20 years ago, Higginson et al (1998) examined ten year trends in where cancer patients die across regions in England. This early work found a trend of declining home deaths, in people with certain cancer types (e.g. lung and colorectal cancer) being consistently more likely to die at home than other cancer conditions.
The observed variation in place of death was explored further in a subsequent publication examining the impact of social factors (Higginson et al, 1999). Deprivation was found to be inversely related to home death in electoral wards, which may explain some of the variation observed. As part of a more recent investigation of geographic variation in place of death, Chukwusa et al (2019) found that geographical accessibility is associated with death in inpatient palliative and end of life facilities, particularly in rural areas.
Trends in place of death have since been used to project future patterns, taking into account the effect of population ageing, to inform service planning. Gomes and Higginson (2008) used data from 1970s and found a long-standing trend of declining home deaths in England and Wales. This work influenced national policy and the first End of Life care Strategy emphasised the importance of death in preferred care setting.
There has been growing recognition of the importance of understanding patterns of health care utilisation in the months before death, not just at the time of death. Henson et al (2017) examined cancer patients’ emergency department attendances in the last month of life and found that low socioeconomic status, younger age and being male increased attendance. Subsequent work has examined this end of life outcome in other non-cancer populations to identify groups at higher risk of attendance (Sleeman et al, 2018; Bone et al, 2019).
As well as understanding where people will require care towards the end of life, an understanding of patients’ needs at a population level is also essential for planning services. Murtagh et al (2014) refined methods for estimating palliative care need, based on cause of death data. This method has subsequently been applied to trend data and used to project future palliative care need (Etkind et al, 2017), highlighting the growing palliative care needs of the population of England and Wales and calling for urgent action to prepare for this.
The Atlas presents these key end of life outcomes in an interactive and user-friendly online tool. This provides organisations with the means to understand their local population and end of life outcomes in relation to other areas and the national picture to support local improvements. By highlighting unwarranted variation, this tool is the first step to improving care for the half a million of people who die each year in England.