22 November 2023
Metals, markets and melting points: deriving market expectations of global warming from commodities prices
Evangelos Drellias, Pre-Doctoral Researcher and Joseph Noss, Visiting Fellow at the Qatar Centre for Global Banking and Finance
This blog extracts information on market participants’ beliefs as to the future extent of global warming from the prices of commodities.

Some commodities (e.g. copper, lithium, nickel and cobalt) are likely to play a critical role in the transition to net-zero emissions (e.g. due to their use in electric vehicles). Under a credible net-zero transition scenario the demand for such commodities – and hence their present value – should therefore increase.
This article develops a methodology that uses the market prices of such commodities to estimate a market-implied probability distribution of future global temperatures. Market expectations of global temperatures in 2050 have decreased by around 0.4°C since 2010 but have been quite volatile. Market-expectations of future temperatures fell particularly sharply between 2020 and 2022 – a period that saw increased commitments by policymakers to reducing emissions (e.g. COP26). Market-implied uncertainty around these central expectations of global temperatures increased over the same period.
Furthermore, this blog uses the prices of commodities to derive estimates of market participants’ beliefs as to the future extent of global warming. The commodities whose prices it uses are those that are likely to play a crucial role in the transition to a low carbon economy and the expansion of low carbon technologies: specifically, copper, lithium, nickel and cobalt. Several of these commodities provide crucial components of batteries for electric vehicles – the adoption of which is likely to play a key role in the replacement of cars with internal combustion engines. Demand for copper is likely to increase in order to reconfigure electricity grids.
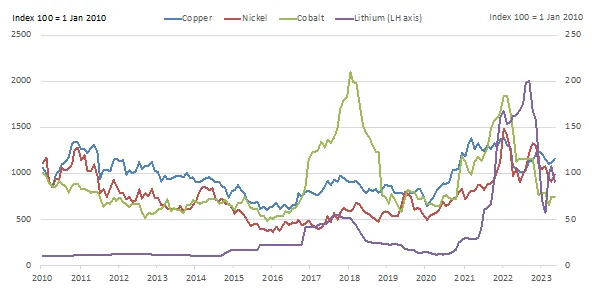
The approach taken here assumes that the price of these commodities (see Chart 1) reflects investors’ beliefs as to their future demand, including in order to facilitate the transition to low emissions, and hence reducing global warming. The lower global temperatures are to remain, the greater the subsequent demand for such commodities. Higher commodity prices are therefore, in the long-term, assumed to reflect a lower quantity of global emissions, and hence lower global temperatures. The prices of commodities can therefore be used to infer information as to their future demand, and hence the degree of global warming expected by market participants that trade them.[1]
There is a strong tradition of central banks and other policymakers extracting information from the prices of financial securities. Under the efficient market hypothesis, the prices of securities reflect publicly available information relating to their future payoffs. Policymakers can therefore use these prices to back out information about these expected future cashflows. For example, central banks use equity prices to derive investors’ perceptions of future dividends. Bond and swap market prices can communicate investors’ views on the future paths of interest and and inflation rates. Prices of structured credit instruments have been used to back out information on investors’ perceptions of systemic risks.
To the best of the authors’ knowledge, however, this is the first-time information on commodity prices has been used to derive information on future global temperatures.
Chart 1: The prices of some transition-critical commodities
Moving beyond emissions
Current approaches to deriving information on global warming from financial securities typically focus on the emissions embodied in a firm or assets’ operations and assets. For example, the financial community has started to use the metric ‘implied temperature increase’, to measure the degree to which a firm (or security it issues) is aligned with a transition to net zero emissions. An implied temperature increase is the increase in global temperatures that would occur if an economy (or sector within it) gave rise to emissions similar to a given firm.
However, a firms’ emissions give only a very crude indication of the degree to which a firm or asset is likely to lead to a given level of global warming. Recent research suggests that firms’ emissions provide little information on the degree to which they – or the technology or assets in which they invest – is likely to enable transition elsewhere in the economy. Some firms that are relatively low emitting may disrupt net-zero transition – for example, those supplying software to oil and gas companies. Other firms that are high emitting are likely to enable a reduction of emissions elsewhere in their value chains – for example those mining commodities that will play a crucial role in facilitating transition.
To surmount this problem, this blog article instead uses the market prices of commodities to back out estimates of market expectations of global temperatures. Doing so abstracts from the quantity of emissions embodied in the extraction and processing of these commodities, and instead focusses more on the broader value of these commodities as a means of reducing global warming in the wider economy – eg. by enabling low carbon technology.
Methodology: commodities as options on future global temperatures
To extract information on global warming from commodity prices, we develop a simple model of commodities prices as a function of market participants’ expectations of global temperature increases. We consider commodities to be analogous to an ‘option’ on future temperatures: that is, a financial security whose value is a function of the future trajectory of global warming. In reality, of course, commodity prices are likely to be influenced by a variety of factors that reflect their supply and demand. But to the extent that, at least in the long-term, supply and demand for these commodities is affected by their role in transition, the methodology provides at least an indication of global warming based on market prices.
The sort of option we choose is a ‘put’ option, which are widely used by financial practitioners, and can be valued using the Black-Scholes model. We consider commodities as analogous to put options whose value is the discounted future value of the difference between a given ‘strike temperature’, and the future level of global temperatures. The ‘strike temperature’ is the maximum level of future temperatures at which the commodity has value. The lower temperatures are expected to remain below this value, the greater the value of option (and commodity), because of implied demand for the commodity in the subsequent net zero transition. If temperatures eventually exceed this value, the option (and hence commodity) will be less valuable.[2]
We assume global temperatures follow a ‘Geometric Brownian motion’: a stochastic process used widely elsewhere in finance literature. Under such a process, the expected percentage increase in global temperatures over any period of time is to equal the long-term increase in temperatures, or ‘drift’. But the actual change in temperatures is also random and varies over time random (stochastic) component that is drawn from a normal distribution with mean zero, and some constant standard deviation (or ‘volatility’). Together, this drift and volatility determine the mean and standard deviation of the distribution of global temperatures at a given future point in time (e.g. in 2050).[3]
The approach taken here is to find the value of drift and volatility – that is, the average increase in, and volatility of global temperatures over time – under which the modelled prices of commodities match those observed in market.[4] To the extent that the model captures the long-term drivers of the value of commodities (or at least that due to their role in net zero transition), then the distribution of global temperatures consistent with this drift and volatility will match the distribution of temperatures expected by market participants.
We calibrate the parameters of the model so that the value of commodities implied by our model matches that observed in the market at the most recent point in the data set (June 2023). To do so, we take the real-world forecast of global temperatures in 2050 given by the Intergovernmental Panel on Climate Change in their 2023 Sixth Assessment Report.[5] We set the drift and volatility of the stochastic process governing global temperatures in our model equal to values such that the resulting distribution of global temperatures given by the model matches that in the IPCC forecast. We then find parameters for the model so that the modelled prices of commodities precisely equals those observed in June 2023.[6]
We then fit the model to 162 monthly observations of the prices of each of four commodities (copper, lithium, nickel and cobalt) between January 2010 and June 2023. For each month, we obtain the drift and volatility that minimises the average difference between the modelled and observed prices of the four commodities. This yields a monthly time series of drift and volatility, which can then be transformed into a time series of the market-implied mean and variance of the distribution of global temperatures in 2050, on each of these dates.[7]
Results
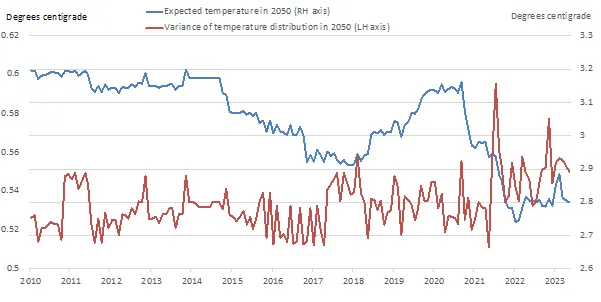
Chart 2 below shows the mean and standard deviation of global temperatures in 2050 derived from monthly observations of the market prices of copper, lithium, nickel and cobalt between 2010 and 2023.
|
Chart 2: Expectations and variance of the distribution of global temperatures in 2050 |
There are four key takeaways:
- First, the level of market-implied expected global temperature in 2050 (blue line in Chart 1) has decreased a little in the past thirteen years, from over 3.2°C in 2010, to its current level of around 2.8° This is reflected in the average increase in the price of the four commodities (Chart 2), which may – at least in part – reflect increased demand for use in net-zero transition.
Expected future global temperatures reach their lowest value in 2022, which coincides in a sharp, if temporary, increase in the value of lithium around the same time. This might reflect increased beliefs on the part of market participants as to the strength and credibility of policy-makers willingness to drive a transition to net-zero emissions around this time. There was a sharp acceleration of policymaker efforts in this vein in 2021, reflected in the UK-hosted COP26 summit and formation of GFANZ (a coalition of financial institutions committed to reducing global emissions).
- Second, the market-implied expected global temperature in 2050 increased slightly in the 18 months following January 2022. This may reflect a partial reticence on the part of some governments and electorates to apply adhere to the pledges for emissions reduction that were affirmed at COP26: for example, the recent ESG ‘backlash’ in some US states, or partial retraction of some emissions reduction commitments by the UK government
- Third, there is significant volatility over time in the market-implied expected temperature in 2050. The expected temperature decreases by around 10% in the period between 2014 and 2018 – a period in which there was an increasing consciousness amongst financial institutions and their regulators of the role of climate-related risks. Expected temperatures then increase in the period 2018 to 2022, before falling sharply in the run up to COP26. Importantly, this variation in expected future temperatures far exceed that implied by the smooth transition paths for global temperatures found in official-sector climate scenarios.
- Finally, despite the reduction in expected temperatures over the past 13 years, the variance of the market-implied distribution of global temperatures (red line in Chart 1) has increased in the period since 2021. This might reflect residual uncertainty on the path of market participants as to the strength and credibility of policymaker pledges to drive net-zero transition.
Conclusion
This blog article offers a means of backing-out market participants’ expectations of the future distribution of global temperature increases from the prices of commodities likely to play a crucial role in the transition to net-zero emissions. To the extent that the current prices of these commodities reflect investors’ beliefs as to the extent and speed of the net-zero transition, they allow us to infer investors’ beliefs as to the extent of global warming. The methodology offers an improvement over other methods of assessing inferring increases in temperatures from firms’ emissions.
The methodology may be of use to policymakers interested in market perceptions of the future trajectory of global warming. Based on the results offered here, market expectations of global temperatures in 2050 have decreased a little since 2010, but are quite volatile. Market perceptions of the net-zero transition appear to vary over time in line with changes in the perceived strength and credibility of policymakers/politicians’ commitments to net-zero transition.
Footnotes:
[1] The commodities used here are those for which demand – and hence their value – is likely to increase under a net-zero transition scenario. In principle, it would also be possible to infer expectations of global warming from the prices of commodities (such as oil and gas) for which demand – and hence their value – is likely to decrease under transition
[2] Specifically, we assume the value of each commodity to be equal to the value of a perpetual American put option. The value of such an option takes the value of when exercised at time T, where K is the strike temperature and ST the value of global temperatures at time T; p is a constant that whose value is found as part of the calibration of the model (see below).
[3] Global temperatures could also be modelled complex stochastic process, including, for example, that incorporating a degree of mean reversion or jumps; this is, however, left as further work.
[4] Formally, we find the drift and volatility that minimize the sum of squared percentage difference between the observed market price of each of the four commodities and their value imputed by the model.
[5] In 2023 the IPCC forecast that their central expectation of global temperatures in 2050 was 2.8°C.
[6] Formally, we solve for the value of p such that the payoff of the option representing the value of each commodity, , matches that observed in the market, where the value of the stochastic process ST has a distribution equal to that forecast by the IPCC report where T = 2050.
[7] We choose 2050 because this is the latest year considered by official-sector climate scenario analysis (for example that by the Bank of England); but it is also possible to derive market-implied distributions of temperatures for any future date.