04 May 2020
Do central bank stress tests encompass the Covid crisis?
Professor David Aikman, Director of the Qatar Centre for Global Banking & Finance and Dr Eleonora Muzzupappa, Teaching Fellow in Banking and Finance
In Donald Rumsfeld’s famous taxonomy, the Covid crisis is best thought of as a “known unknown” for financial stability.

In Donald Rumsfeld’s famous taxonomy, the Covid crisis is best thought of as a “known unknown” for financial stability. While the risks associated with a pandemic were at the top of governmental risk registers, there had not been a recent regulatory stress test to gauge how the financial system might fare in such an event. Despite this, the Covid shock is manifesting itself in steep falls in activity globally and in large drops in various asset prices – scenarios that have been front-and-centre in central banks’ stress testing programmes since the last crisis.
In this piece, we ask: do central bank stress tests “encompass” (i.e. assume a more severe stress than) the Covid crisis? As banks tend to be capitalised to pass these stress tests, answering this question helps us understand the solvency threats banks are likely to face in the period ahead.
Economic indicators vs stress scenarios
To examine this question, we compare movements in a variety of economic indicators since the outbreak began with the assumptions used in the latest stress tests run by the Fed Board, the Bank of England, and the European Banking Authority (EBA). In particular,
- For the financial market variables, we compare the assumed paths in stress scenarios against developments in equivalent variables from the start of this year through 20 April. We also use local peaks or troughs experienced since the Covid outbreak began as a comparison point.
- For real economy variables (growth and unemployment), we compare stress scenario paths against the International Monetary Fund’s latest World Economic Outlook (WEO) projections, published in April – the latest consistent set of macroeconomic forecasts available at the time this article was written.
A caveat is in order before we delve into this comparison. Market prices obviously provide a noisy signal of the eventual scale of disruption this crisis will bring. This statement applies a fortiori to economic forecasts in these unprecedented circumstances – these will be revised substantially as the duration of the lock-down becomes clearer. Given this, the exercise is best thought of as an interim assessment of whether the Covid crisis is likely to overwhelm the capital buffers banks have built up.
Federal Reserve Board
Chart 1 compares the shocks to asset prices (upper panel) and real economy variables (lower panel) in the Fed’s 2019 “Severely Adverse” scenario with developments we’ve seen in the Covid crisis to date. The blue bars show stress test values; red bars show movements in the data this year; green bars are IMF’s WEO projections.
Chart 1: Fed Board 2019 Severely Adverse Scenario vs data outturns and IMF forecasts
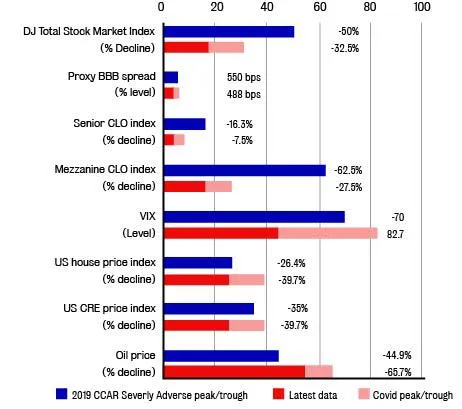
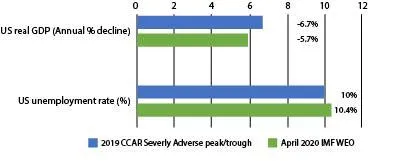
The Fed’s 2019 stress test measures up quite well against financial market developments to date. The shocks assumed to equity prices, corporate bond spreads and prices of Collateralised Loan Obligations (CLOs) – securitised tranches of risky corporate debt – are significantly greater than what we’ve seen in the Covid crisis so far. And while at one point in recent weeks the jump in the VIX – a measure of expected volatility in US equity markets – had exceeded that assumed in the stress test, it is now comfortably below this level.
The judgement is more finely balanced for property prices, which we benchmark against movements in an index of US-focused Real Estate Investment Trusts (REITs), covering both residential and commercial property. REITs were down almost 40per cent at one point this year, and at the time of writing are 25 per cent lower. If this proves to be a good forecast for actual house price falls, it may be uncomfortably close to the 26 per cent drop assumed in the Fed’s scenario.
One area where the shock exceeds that assumed in the test is the oil market: the collapse in oil prices we’ve seen this year has far exceeded the 45per cent decline assumed in the Fed’s scenario.
Turning to the real economy, perhaps surprisingly the year-on-year fall in US real GDP assumed in the Fed’s scenario (-6.7 per cent) is more severe than that expected by IMF (-5.9 per cent) for 2020. The economic contraction in the second quarter this year will far exceed any previous decline on record – JP Morgan, for instance, is forecasting a mammoth 40 per cent quarter-on-quarter contraction (expressed as an annualised rate). But the IMF’s forecast is predicated on the economy normalising in the second half of 2020. Even assuming this, it is forecasting that unemployment will reach 10.4 per cent, exceeding that assumed in the stress scenario. Clearly there are downside risks to the IMF’s projections if shutdowns persist longer or we see a second wave of the pandemic.
Bank of England
Chart 2 repeats this exercise for the Bank of England’s 2019 Annual Cyclical Scenario.
Chart 2: BoE 2019 Adverse Cyclical Scenario (ACS) vs data outturns and IMF forecasts
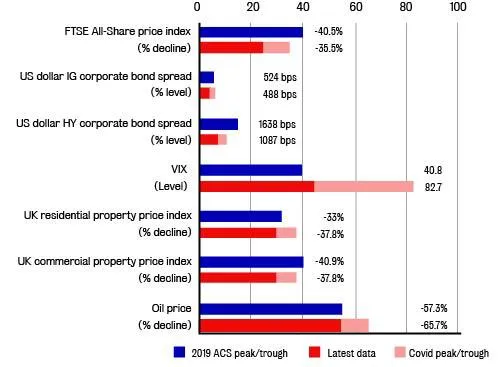
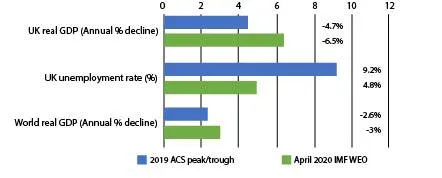
This scenario also looks to be well calibrated. The test assumed shocks to equity prices and corporate bond spreads that are somewhat more severe than the falls in these indicators we’ve experienced this year – although the equity market decline at its peak was close to that assumed in the test. While UK-focused REITs were almost 38 per cent down by late March – close to the property price falls assumed in the Bank’s test – they have since recovered somewhat.
Movements in other financial market indicators have exceeded the Bank’s test scenario, however. The VIX jumped to 82.7 at its peak, and while it has receded from this level, it remains higher than assumed in the test. The collapse in global oil prices to date has been greater than assumed in the Bank’s scenario.
Turning to real economy variables, the profile for unemployment – a key driver of household default risk – in the Bank test is significantly more severe than in the IMF’s latest forecasts. Its forecasts for growth in the UK and world economies are much weaker than assumed in the stress test, however. The IMF expects UK GDP to contract in 2020 by 6.5 per cent, while the Bank’s test assumed a 4.7 per cent fall. Similarly, the IMF expects world GDP to fall by three per cent, a larger drop than the 2.6 per cent fall in the Bank’s test.
European Banking Authority
Finally, Chart 3 presents results for the EBA’s 2018 Adverse Scenario – the most recent test it has run.
Chart 3: EBA 2018 Adverse Scenario vs data outturns and IMF forecasts

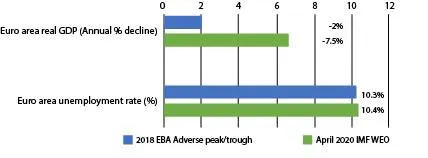
Here, the comparison is less favourable. The falls in financial market variables we’ve seen this year have exceeded the shocks assumed in the EBA’s scenario. Shocks to corporate CDS premia, European-focused REITs and oil prices have all far exceeded that assumed in the test.
The comparison is also unfavourable on the real economy side. The EBA’s scenario assumes a shallow, persistent recession. The cumulative fall in euro area GDP is -2.4 per cent, with a peak year-on-year decline of just -2per cent. This is dwarfed by the -7.5 per cent contraction being forecast by the IMF for 2020 – a forecast itself subject to material downside risks. The EBA’s scenario for unemployment is close to the IMF’s current forecast, however.
Conclusion
The Fed Board and Bank of England’s latest stress scenarios broadly encompass current estimates of the scale of the Covid crisis, as embodied in forward-looking financial market indicators and the IMF’s latest economic forecasts. Our interim assessment therefore is that US and UK banks look to be capitalised to withstand the shock in train – though there are material downside risks to this assessment if these economies fail to normalise in the second half of this year.
This assessment might seem surprising given the unprecedented shutdown we are living through. It reflects the extreme tail scenarios chosen by the Fed and the Bank in their scenarios, plus the aggressive policy actions taken by central banks and fiscal authorities, which have boosted confidence in the financial system and stemmed the amplifying factors we might otherwise have seen.
We are less sanguine about prospects for euro area banks. The EBA’s latest stress scenario is significantly less severe than developments in market indicators and forecasts since the Covid outbreak began. If euro area banks are capitalised to pass the EBA’s scenario, this suggests we may see further solvency concerns arising for its banking system in the period ahead.


