Electron Tomography (ET)
Electron tomography (ET) is a powerful technique to generate a detailed 3D volume which reveals structures of sub-cellular macro-molecular objects at the nanometre scale.
Electron tomography is an extension of traditional transmission electron microscopy (TEM). Rather than collecting a single image with the specimen held horizontally in the TEM beam, the specimen is tilted and an image collected at a number of tilt angles. In this way a tilt series of images is collected of the sample at incremental degrees of rotation around the eucentric point. As the middle of the specimen lies on the rotation axis of the specimen when the specimen is tilted, the point being observed remains stationary.
This information is then aligned and assembled as a 3D image stack. A weighted back-projection is then used to generate a 3D tomographic volume revealing 3D organisation of organelle and their interactions. This is important because conventional 2D representation of a 3D specimen in a TEM disguises details which exist in the z-direction. This can lead to difficulty in interpreting structures.
Examples of use
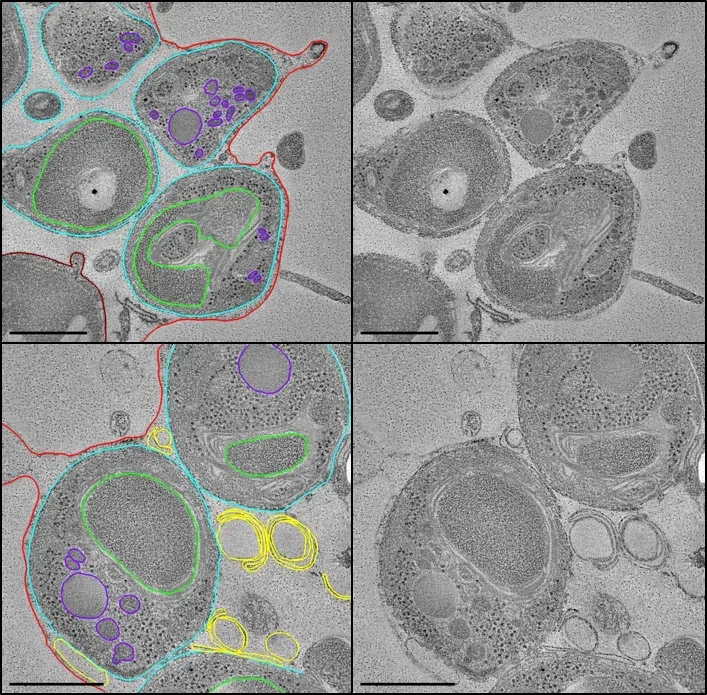
Tomography is invaluable when used to study 3D interrelationships between intracellular organelles.
When combined with single particle reconstruction, sub tomogram averaging can provide near atomic resolution structures in situ.
Collaborations at the centre have employed tomography and sub-tomogram averaging to understand the structure of cytoadherent knobs on the surface of the infected erythrocyte and changes in the parasitophorous vacuole which precede rupture and host erythrocyte cytoskeleton collapse during Plasmodium falciparum egress.
Equipment available
- JEOL JEM F200
- JEOL JEM 1400Plus.

