11 June 2020
Which areas in England and Wales are most affected by Covid-19 and why?
Dr Filipa Sá says the answer is key to shaping the right policy responses

The Covid-19 pandemic raises many important questions for economists. It is important to establish which groups in society are most affected by the pandemic so that policy responses can be targeted appropriately. I use data on Covid-19 infections and mortality for small local areas in England and Wales and study the link with socioeconomic factors, such as population density and household size, ethnicity, health, deprivation and use of public transport.
The geography of Covid-19
There are wide variations in Covid-19 infection rates and mortality rates across the country. The local authority with the highest infection rate in early May 2020 was Barrow-in-Furness in North-West England, with over 800 Covid-19 cases per 100,000 people. Nearby Lancaster and South Lakeland and the North East region around Gateshead, Sunderland and South Tyneside were also hotspots. Wales has very high infection rates, but this is due to a higher frequency of testing compared to England.
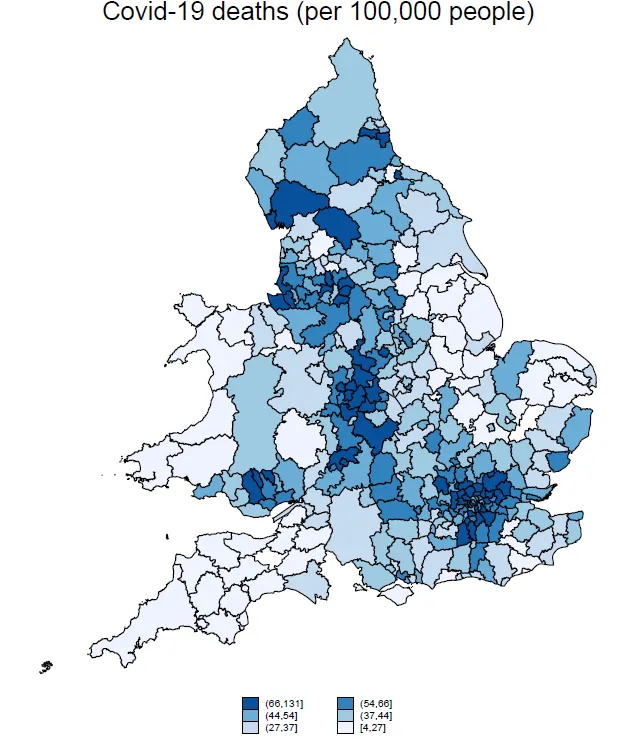
The picture is different for mortality rates. As of 24 April 2020, the local authority with the highest mortality rate was Hertsmere in Hertfordshire, with 131 deaths per 100,000 people. The neighbouring North London boroughs of Harrow, Barnet and Enfield also had high mortality rates. Out of the 10 local authorities with the highest mortality, six are in Greater London.

The socioeconomic determinants of infection and mortality rates
Using simple correlations and regression analysis, we can see that local authorities with larger households, worse levels of self-reported health and a larger proportion of people using public transport have more Covid-19 infections per 100,000 people. Household size and use of public transport have a less important influence on mortality rates which have a stronger to the average age of the population, ethnicity and self-reported health. Local authorities with an older population, a proportionally larger black or Asian population and worse levels of self-reported health have more Covid-19 deaths per 100,000 people.
Policy implications
The relation between self-reported health and confirmed infections and mortality suggests that encouraging a healthy lifestyle can help prevent worse outcomes and deaths from the disease. Also, as many countries now begin to relax lockdown measures, policymakers should pay particular attention to reducing the risk of infection in public transport. This can be done by encouraging people to use other forms of transport, as is being done in the UK, but also by increasing the frequency of services to avoid overcrowding.
Businesses should also take the risk of infection in public transport into account when deciding how to get their employees back to the office. Working from home should continue to be encouraged when possible, especially for those who have to travel to work by public transport. For jobs where working from home is not possible, other new patterns, such as the proposal by the Royal Society of Arts (RSA) of splitting the work week into two three-day shifts could be considered. This is particularly relevant in London, where more than half of employed workers travel to work by public transport, compared with a national average of 13 per cent.
Reference
Sá, Filipa. (2020). `Socioeconomics Determinants of Covid-19 Infections and Mortality: Evidence from England and Wales', Covid Economics: Vetted and Real-Time Papers, Issue 22: May 26, 2020
In this story

Reader in Applied Economics